
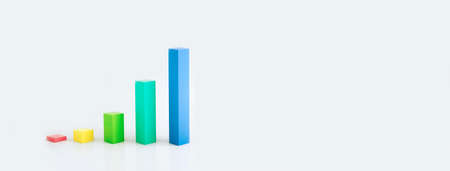
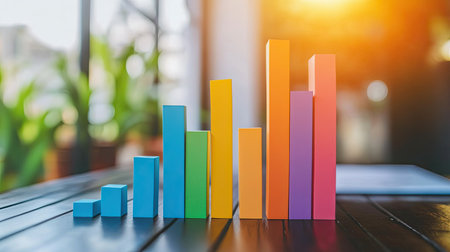
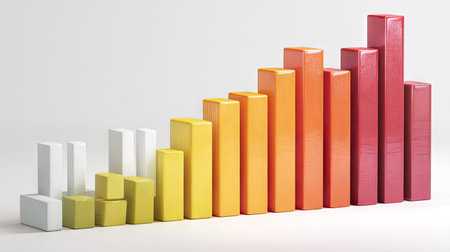
A bar chart displaying quarterly revenue growth for a successful business, with colorful bars rising high.
Коллекция по умолчанию
Коллекция по умолчанию
Создать новую
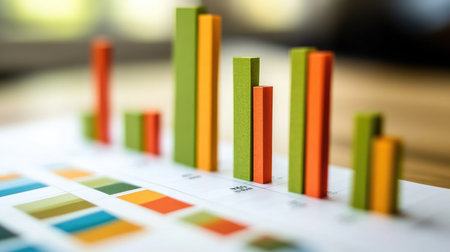
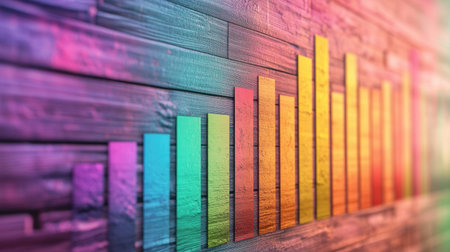
Business graph diagram with multicolored bars with rise dynamic against blue background
Коллекция по умолчанию
Коллекция по умолчанию
Создать новую
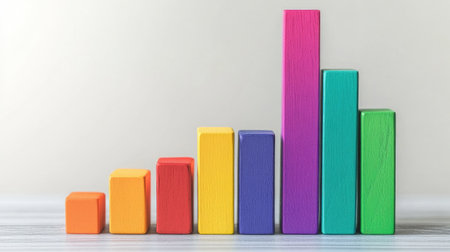
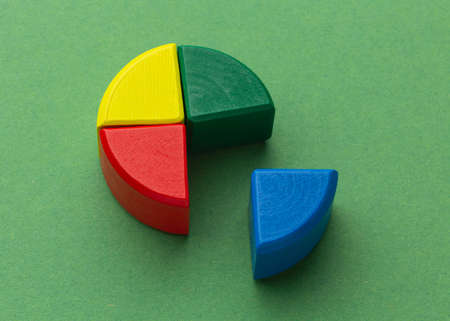
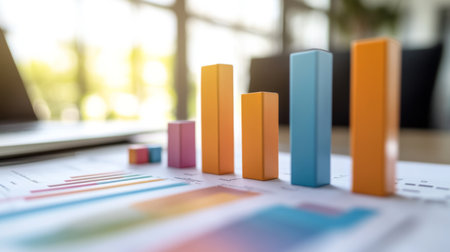
Market segmentation and targeting concept. Color figures on the desk.
Коллекция по умолчанию
Коллекция по умолчанию
Создать новую
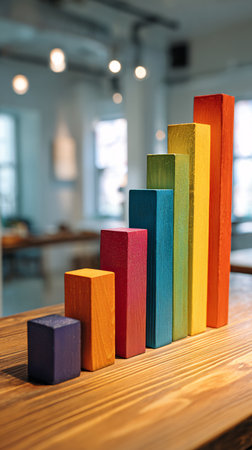
A colorful wooden block with an arrangement of stair or graph.
Коллекция по умолчанию
Коллекция по умолчанию
Создать новую
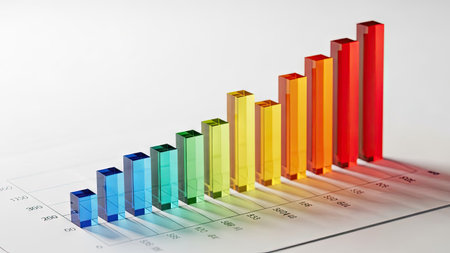
3d render graph over gray background, rainbow business infographic, panoramic layout
Коллекция по умолчанию
Коллекция по умолчанию
Создать новую

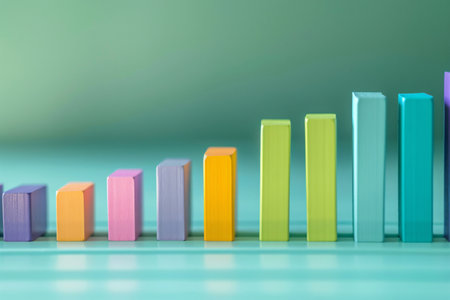
Colorful wooden blocks in a row on the background of a graph
Коллекция по умолчанию
Коллекция по умолчанию
Создать новую
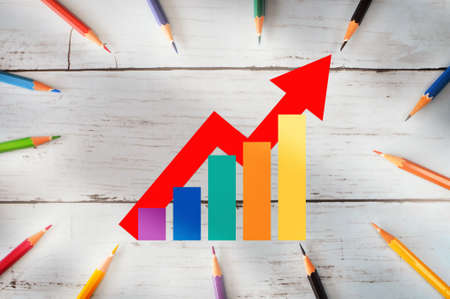
Rainbow lgbtq symbol growth graph with arrow upward on wooden background. Lesbian gay bisexual transgender concept and marketing communication trading making money idea
Коллекция по умолчанию
Коллекция по умолчанию
Создать новую

A multi-hued building with numerous windows stands out in vibrant colors against the surrounding cityscape, Colorful bar graphs displaying sales data, AI Generated
Коллекция по умолчанию
Коллекция по умолчанию
Создать новую
Colorful wooden blocks on the table in the office, business concept
Коллекция по умолчанию
Коллекция по умолчанию
Создать новую

Statistical financial graph predicting an economic depression after a 2020 global coronavirus pandemic.
Коллекция по умолчанию
Коллекция по умолчанию
Создать новую
Creative bar graph made from colorful blocks, set against a white minimalist background
Коллекция по умолчанию
Коллекция по умолчанию
Создать новую

colorful, five rainbow colored sponges on blue background
Коллекция по умолчанию
Коллекция по умолчанию
Создать новую
A colorful bar chart showing quarterly sales growth for a tech startup, with upward trends highlighted
Коллекция по умолчанию
Коллекция по умолчанию
Создать новую

Colorful bar charts and line graphs representing financial data, illustrating the performance and trajectory of a successful business.
Коллекция по умолчанию
Коллекция по умолчанию
Создать новую
AI Generated. Colorful wooden blocks arranged in bar graph on blackboard surface
Коллекция по умолчанию
Коллекция по умолчанию
Создать новую
Colorful wooden blocks stacking as step stair. Business growth concept.
Коллекция по умолчанию
Коллекция по умолчанию
Создать новую
This image features colorful wooden blocks arranged in ascending order, representing growth and analysis in business metrics and statistics. Perfect for visualizing progress.
Коллекция по умолчанию
Коллекция по умолчанию
Создать новую
A close-up of a business report with colorful bar and line graphs.
Коллекция по умолчанию
Коллекция по умолчанию
Создать новую
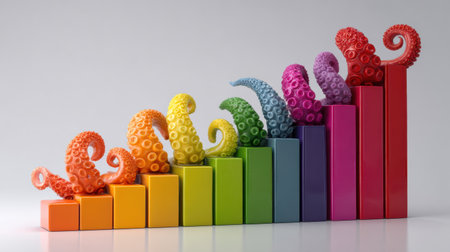
Colorful tentacles support a rising bar graph, illustrating business growth and success in a corporate-themed scene.
Коллекция по умолчанию
Коллекция по умолчанию
Создать новую

Child's hand arranging wood blocks in a step stair concept. Concept for growth, strategy, success process or investment goals.
Коллекция по умолчанию
Коллекция по умолчанию
Создать новую

Row of vibrant wooden arrows displayed against a clean white wall.
Коллекция по умолчанию
Коллекция по умолчанию
Создать новую
A detailed close-up of a business bar graph with glossy bars, showcasing performance metrics, against a light background with soft focus elements for a professional look.
Коллекция по умолчанию
Коллекция по умолчанию
Создать новую

Colored sticker stripes on business analytics chart closeup
Коллекция по умолчанию
Коллекция по умолчанию
Создать новую
A vibrant arrangement of colorful wooden blocks illustrating growth and progress. This image can be used in business, education, or creativity themes.
Коллекция по умолчанию
Коллекция по умолчанию
Создать новую

Three multi-colored blocks of the plasticine growth chart. Space for text
Коллекция по умолчанию
Коллекция по умолчанию
Создать новую

Hand stacking colorful wooden blocks into rising bar graph
Коллекция по умолчанию
Коллекция по умолчанию
Создать новую
Multi Colored Business Graph With Red Arrow Sign Showing Upward Direction
Коллекция по умолчанию
Коллекция по умолчанию
Создать новую

Virus pandemic covid-19 map on pc screen, global infection, internet.
Коллекция по умолчанию
Коллекция по умолчанию
Создать новую
A bar chart with horizontal bars indicating values for different categories AI generated
Коллекция по умолчанию
Коллекция по умолчанию
Создать новую
Colorful bar chart illustrates growth trends against vibrant yellow and blue backdrop
Коллекция по умолчанию
Коллекция по умолчанию
Создать новую

Sales growth and development illustrated on a graph
Коллекция по умолчанию
Коллекция по умолчанию
Создать новую

Shallow depth of field (selective focus) with details of a chart showing the stock market crash from March 2020 due to the Covid-19 pandemic on a computer screen (S&P500 index)
Коллекция по умолчанию
Коллекция по умолчанию
Создать новую
A row of seven wooden blocks, painted in a rainbow of colors, are arranged in an ascending pattern. The blocks are isolated on a white background.
Коллекция по умолчанию
Коллекция по умолчанию
Создать новую
A vivid arrangement of colorful blocks in ascending order, showcasing a visually appealing gradient. Ideal for concepts of growth, progress, and creativity.
Коллекция по умолчанию
Коллекция по умолчанию
Создать новую

Stock market or forex trading graph in graphic concept suitable for financial investment or Economic trends business idea and all art work design.
Коллекция по умолчанию
Коллекция по умолчанию
Создать новую
A 3D bar graph with data labels and percentage values displayed above each bar, providing a clear and informative business analysis
Коллекция по умолчанию
Коллекция по умолчанию
Создать новую
Data-driven online advertising, with digital banners, targeted metrics, and social media ads driving user engagement.
Коллекция по умолчанию
Коллекция по умолчанию
Создать новую
This vibrant image showcases a colorful data visualization with vertical bars on a digital screen, representing various metrics and trends in an engaging manner.
Коллекция по умолчанию
Коллекция по умолчанию
Создать новую

Financial stock market uptrend analysis with line graph on soft colored background for evaluation
Коллекция по умолчанию
Коллекция по умолчанию
Создать новую
Colorful rectangular blocks arranged in a pattern, showcasing varying heights and vibrant hues against a white background.
Коллекция по умолчанию
Коллекция по умолчанию
Создать новую
A vibrant bar graph illustrating company earnings with colorful metrics, designed for business analysis. Perfect for presentations and financial reports.
Коллекция по умолчанию
Коллекция по умолчанию
Создать новую

Many type of infographic diagram over white background. Top view.
Коллекция по умолчанию
Коллекция по умолчанию
Создать новую
Closeup, graphs and screen with data analysis, information and market research with financial
Коллекция по умолчанию
Коллекция по умолчанию
Создать новую
This image features a colorful bar graph on paper, showcasing pastel-colored bars that represent various data points, ideal for business and educational uses.
Коллекция по умолчанию
Коллекция по умолчанию
Создать новую
This vibrant image features a colorful growth chart with a series of 3D bars representing business progress and success, ideal for analytics and marketing materials.
Коллекция по умолчанию
Коллекция по умолчанию
Создать новую

Abstract Financial Data Visualization, Blue Column Chart, Line Graph Overlays in Vibrant Colors
Коллекция по умолчанию
Коллекция по умолчанию
Создать новую

colorful bar graph pie chart desk pink background
Коллекция по умолчанию
Коллекция по умолчанию
Создать новую
A minimalist financial bar graph with pastel-colored bars, showing quarterly revenue, displayed on a clean white background with simple grid lines and clear labels.
Коллекция по умолчанию
Коллекция по умолчанию
Создать новую
Colorful bar graph gradually increasing, symbolizing growing statistics
Коллекция по умолчанию
Коллекция по умолчанию
Создать новую
A vibrant display of pastel color swatches arranged on a light background, ideal for exploring color combinations and creative design concepts. Perfect for artists and designers.
Коллекция по умолчанию
Коллекция по умолчанию
Создать новую
Coronavirus virus covid-19 chart, crisis, economy down, 2019-ncov graph epidemic
Коллекция по умолчанию
Коллекция по умолчанию
Создать новую
Stats concept with wood pie chart
Коллекция по умолчанию
Коллекция по умолчанию
Создать новую
A vibrant bar graph is displayed on a white background, showcasing a progression of colorful bars. The bars ascend in height, illustrating growth and upward trends. Various colors blend smoothly, suggesting a dynamic business or financial theme, suitable for diverse commercial uses and editorial content.
Коллекция по умолчанию
Коллекция по умолчанию
Создать новую
Business growth chart on a desk with colorful sticky notes, symbolizing entrepreneurship, with copy space
Коллекция по умолчанию
Коллекция по умолчанию
Создать новую
Colorful dominoes on a green background. Business concept.
Коллекция по умолчанию
Коллекция по умолчанию
Создать новую
A close-up view of colorful bar graphs and charts on a desk, representing data analysis and business performance. Ideal for topics on statistics and growth.
Коллекция по умолчанию
Коллекция по умолчанию
Создать новую
Vibrant bar graphs and charts on a table illustrate business analysis and data visualization, showcasing growth and performance metrics in a professional setting.
Коллекция по умолчанию
Коллекция по умолчанию
Создать новую

This image features colorful geometric shapes arranged harmoniously against a soft blue background, perfect for modern design needs in various creative projects.
Коллекция по умолчанию
Коллекция по умолчанию
Создать новую
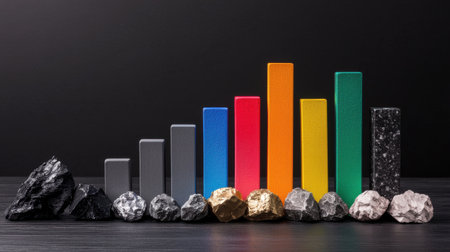
A collection of colorful blocks and rocks are arranged in a line, with some of the blocks being taller than others. Concept of diversity and individuality, as each block
Коллекция по умолчанию
Коллекция по умолчанию
Создать новую
A bar chart with horizontal bars indicating values for different categories AI generated
Коллекция по умолчанию
Коллекция по умолчанию
Создать новую

ballpoint pen indicates income graphs lying on the table
Коллекция по умолчанию
Коллекция по умолчанию
Создать новую
Increase graph with gradient point up arrow concept of business profit 3D rendering illustration
Коллекция по умолчанию
Коллекция по умолчанию
Создать новую

Creative bar graph made from colorful blocks, set against a white minimalist background
Коллекция по умолчанию
Коллекция по умолчанию
Создать новую

Wooden block business growth with arrow up. Business growth rates, creative ideas graph business development to grow profit and success for target concept.
Коллекция по умолчанию
Коллекция по умолчанию
Создать новую

This image features a colorful bar graph on paper, showcasing pastel-colored bars that represent various data points, ideal for business and educational uses.
Коллекция по умолчанию
Коллекция по умолчанию
Создать новую

Colorful wooden blocks stacked in ascending order
Коллекция по умолчанию
Коллекция по умолчанию
Создать новую

A stacked bar graph with soft shadows and gradient colors on a white surface, emphasizing financial or analytical data structure
Коллекция по умолчанию
Коллекция по умолчанию
Создать новую

This image features colorful 3D bars in varying heights, representing growth and statistical data. Ideal for business presentations or educational materials.
Коллекция по умолчанию
Коллекция по умолчанию
Создать новую

Graph of market share with black pen in business concept
Коллекция по умолчанию
Коллекция по умолчанию
Создать новую
Analytic chart element, colorful infographics. Business statistic, diagram, data visualization, graph information.
Коллекция по умолчанию
Коллекция по умолчанию
Создать новую

A financial dashboard displaying a D bar graph with colorful rising bars, set against a dark background with subtle lighting effects.
Коллекция по умолчанию
Коллекция по умолчанию
Создать новую

Analysis of data from graphs. select focus.
Коллекция по умолчанию
Коллекция по умолчанию
Создать новую
Increasing chart with colored pencils on blackboard background. 3d illustration
Коллекция по умолчанию
Коллекция по умолчанию
Создать новую
Red growth arrow on blue background. Arrow graph going up. The economic growth
Коллекция по умолчанию
Коллекция по умолчанию
Создать новую

Miniature people standing on colorful wooden blocks with copy space for text
Коллекция по умолчанию
Коллекция по умолчанию
Создать новую

Blue and pink cubes. The concept of sexism, feminism and equality. Soft focus
Коллекция по умолчанию
Коллекция по умолчанию
Создать новую

3 Photo of a 3D risk management bar chart on a colorful, abstract background
Коллекция по умолчанию
Коллекция по умолчанию
Создать новую
Colorful Financial Charts and Graphs A Bright and Abstract Representation of Market Data
Коллекция по умолчанию
Коллекция по умолчанию
Создать новую
Array of rainbow-colored D bars in a row, gradually increasing in height, with smooth shadows and reflections
Коллекция по умолчанию
Коллекция по умолчанию
Создать новую
Market growth insights analyzing stock trends with rainbow value graphs in a business environment
Коллекция по умолчанию
Коллекция по умолчанию
Создать новую
Colorful blocks arranged in an ascending order symbolize growth and performance in business analytics. This image is perfect for illustrating data improvement and trends.
Коллекция по умолчанию
Коллекция по умолчанию
Создать новую

Abstract bar chart with colorful bars rising, set against a gradient background, business concept
Коллекция по умолчанию
Коллекция по умолчанию
Создать новую
A vibrant and colorful representation of data trends, featuring bars against a textured wooden background, perfect for creative projects and business presentations.
Коллекция по умолчанию
Коллекция по умолчанию
Создать новую
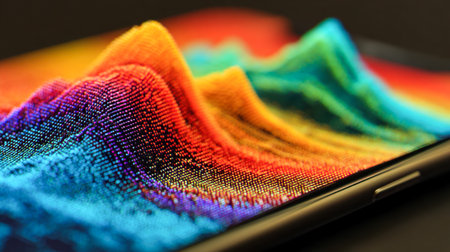
A stunning display of multi-layered, glowing digital waves cascades across a modern screen, blending vivid hues, fine pixel intricacies, and lively illumination in a
Коллекция по умолчанию
Коллекция по умолчанию
Создать новую
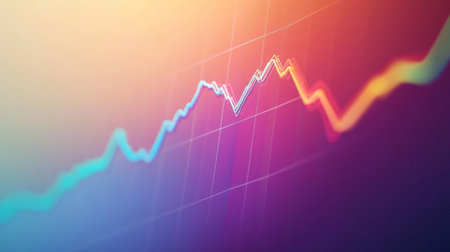
This vibrant abstract image illustrates financial data trends with colorful lines, representing growth and decline in a modern, dynamic style suitable for business and technology themes.
Коллекция по умолчанию
Коллекция по умолчанию
Создать новую

Leadership concept with one red geometric figure next to blue others of different shapes against blue background. Outstanding red geometric figure leading among others
Коллекция по умолчанию
Коллекция по умолчанию
Создать новую
Stock market business graph chart on digital screen
Коллекция по умолчанию
Коллекция по умолчанию
Создать новую

business graph with pen
Коллекция по умолчанию
Коллекция по умолчанию
Создать новую
This vibrant 3D bar graph showcases colorful bars in neon hues, ideal for data visualization and analysis in modern business presentations and reports.
Коллекция по умолчанию
Коллекция по умолчанию
Создать новую

Financial instruments with various types of indicators including volume analysis for professional technical analysis
Коллекция по умолчанию
Коллекция по умолчанию
Создать новую
Monthly percentage bar chart showing financial comparison of 2026 budget versus actual performance data displayed on digital screen. Results tracking.
Коллекция по умолчанию
Коллекция по умолчанию
Создать новую

3 Photo of a 3D risk management chart icon on a background of colorful dots
Коллекция по умолчанию
Коллекция по умолчанию
Создать новую
3d pie chart showcasing business data percentages, set against a seamless gradient background
Коллекция по умолчанию
Коллекция по умолчанию
Создать новую

Colored wooden cubes forming a downward bar chart
Коллекция по умолчанию
Коллекция по умолчанию
Создать новую
Woman holding business reports
Коллекция по умолчанию
Коллекция по умолчанию
Создать новую
GDP bar chart made of colored blocks with rising arrow
Коллекция по умолчанию
Коллекция по умолчанию
Создать новую

A visually striking arrangement of colorful translucent bars creates an artistic display of light and shadow, perfect for modern design projects and vibrant backgrounds.
Коллекция по умолчанию
Коллекция по умолчанию
Создать новую
A vivid and colorful data visualization showcasing dynamic bars representing percentages, ideal for reports or presentations in business and analytics.
Коллекция по умолчанию
Коллекция по умолчанию
Создать новую
Colorful bar graphs display data trends in a modern and vibrant style, perfect for technology and business presentations or analytics projects.
Коллекция по умолчанию
Коллекция по умолчанию
Создать новую

Colorful wooden graph on gray background.
Коллекция по умолчанию
Коллекция по умолчанию
Создать новую
Legion-Media
Создайте свои проекты на основе качественных стоковых фотографий и видео.


Copyright © Legion-Media.